Search This Blog

Wednesday 29 July 2020

Metric types

  • Counter : A counter is a cumulative metric that represents a single monotonically increasing counter whose value can only increase or be reset to zero on restart.
  • Gauge: A gauge is a metric that represents a single numerical value that can arbitrarily go up and down.
  • Histogram: A histogram samples observations (usually things like request durations or response sizes) and counts them in configurable buckets. It also provides a sum of all observed values.
  • Summary: Similar to a histogram, a summary samples observations (usually things like request durations and response sizes).

when to use which metric type?

  • Counters are values that can only increase that keep track of the number of events. For example, we would use counters to start a number of requests, number of errors or the number of Finnish transactions.
  • Gauge is another type of metric that represents numerical value on like counters. Gauges can go up and down to represent the current state of the system. We can use gauges for information that can both increase and decrease over time. For example, memory usage, CPU usage temperature but also a number of conquering requests.
  • Histogram sample observations and count them in configurable buckets. This way we can check how many requests finish within a given time or how many responses fit within a given size, Histogram exposed several metrics for us to query.
  • Summaries calculate configurable. lt's over a sliding time window. In general, many use cases of summaries can be covered with Histogram.

Reference


Tuesday 28 July 2020

Logs VS Traces


Logging Distributed Tracing
Shows the state from the system's point of view. Shows the state from use action's point of view.
Shows events and their meaning. Shows execution path and performance.
Helps with System administration. Help with software debugging.
Readable by humans. Processed by specialized software.

Note: Trace A visualization of the life of a request as it moves through a distributed system.

Wednesday 22 July 2020

kubectl troubleshooting commands

Most useful commands while troubleshoot kubernetes.

Namespace

kubectl get ns
kubectl get namespaces
kubectl get namespace

Pods

kubectl get pods --all-namespaces
kubectl get pods -n [namespace-name]
kubectl describe pod [pod-name] -n [namespace-name]
kubectl get pod [pod-name] -o yaml
kubectl describe pod [pod-name]
kubectl exec [pod-name] -it sh

View Pod logs

kubectl logs -f -c [container-name] [pod-name] -n [namespace-name]
kubectl logs [pod-name]
kubectl logs [pod-name] -c [container-Name]
kubectl logs -p [pod-name]
kubectl logs -f [pod-name]


Additional Information

#List all Container images in namespace
kubectl get pods -n [namespace-name] -o jsonpath="{.items[*].spec.containers[*].image}"


kubectl help


C:\>kubectl help
kubectl controls the Kubernetes cluster manager.

 Find more information at: https://kubernetes.io/docs/reference/kubectl/overview/

Basic Commands (Beginner):
  create         Create a resource from a file or from stdin.
  expose         Take a replication controller, service, deployment or pod and expose it as a new
Kubernetes Service
  run            Run a particular image on the cluster
  set            Set specific features on objects

Basic Commands (Intermediate):
  explain        Documentation of resources
  get            Display one or many resources
  edit           Edit a resource on the server
  delete         Delete resources by filenames, stdin, resources and names, or by resources and
label selector

Deploy Commands:
  rollout        Manage the rollout of a resource
  scale          Set a new size for a Deployment, ReplicaSet, Replication Controller, or Job
  autoscale      Auto-scale a Deployment, ReplicaSet, or ReplicationController

Cluster Management Commands:
  certificate    Modify certificate resources.
  cluster-info   Display cluster info
  top            Display Resource (CPU/Memory/Storage) usage.
  cordon         Mark node as unschedulable
  uncordon       Mark node as schedulable
  drain          Drain node in preparation for maintenance
  taint          Update the taints on one or more nodes

Troubleshooting and Debugging Commands:
  describe       Show details of a specific resource or group of resources
  logs           Print the logs for a container in a pod
  attach         Attach to a running container
  exec           Execute a command in a container
  port-forward   Forward one or more local ports to a pod
  proxy          Run a proxy to the Kubernetes API server
  cp             Copy files and directories to and from containers.
  auth           Inspect authorization

Advanced Commands:
  diff           Diff live version against would-be applied version
  apply          Apply a configuration to a resource by filename or stdin
  patch          Update field(s) of a resource using strategic merge patch
  replace        Replace a resource by filename or stdin
  wait           Experimental: Wait for a specific condition on one or many resources.
  convert        Convert config files between different API versions
  kustomize      Build a kustomization target from a directory or a remote url.

Settings Commands:
  label          Update the labels on a resource
  annotate       Update the annotations on a resource
  completion     Output shell completion code for the specified shell (bash or zsh)

Other Commands:
  api-resources  Print the supported API resources on the server
  api-versions   Print the supported API versions on the server, in the form of "group/version"
  config         Modify kubeconfig files
  plugin         Provides utilities for interacting with plugins.
  version        Print the client and server version information

Usage:
  kubectl [flags] [options]

Use "kubectl  --help" for more information about a given command.
Use "kubectl options" for a list of global command-line options (applies to all commands).


Reference

Sunday 12 July 2020

Docker Error: no matching manifest for windows/amd64 10.0.18362 in the manifest list entries

Docker Error: no matching manifest for windows/amd64 10.0.18362 in the manifest list entries.

Error as below


There are three possible reasons for this error.

  1. Error When Using "Latest" Tag
    While images are rebuilding on DockerHub, the "latest" tag will become momentarily unavailable while updating. This issue will resolve itself or can be mitigated by selecting a versioned tag.
  2. The Tag Is Not Available
    A tag that used to be available may no longer be listed or have had it's naming convention modified. A tag may have been "Version8.0" previously and became "Version8.0.0" recently.
  3. Image Is Not Designed For x86, Such As ARM
    The image you are trying to build may be designed to run on a different architecture, such as an ARM-based CPU.

Solution as below

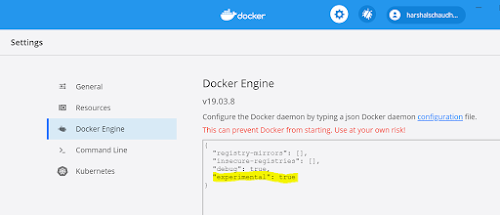
  1. Enable the docker setting "experimental" as true.

  2. docker pull graphiteapp/graphite-statsd:[Specific version > other than latest or older and stable version.
    so I have tried with version 1.1.7-3, docker command as below
    docker pull graphiteapp/graphite-statsd:1.1.7-3

Screenshot as below

Graphite


Saturday 11 July 2020

Grafana: HTTP Error Bad Getway

How to solve Grafana: HTTP Error Bad Getway.

Reason: Grafana app not able to find the "Graphite App instance".


"For the time being" follow below steps

  1. Install Graphite with port 8080, step as below
  2. Pull docker image:
    docker pull graphiteapp/graphite-statsd:latest
  3. Run docker image:
    docker run -d --name graphite --restart=always -p 8080:80 -p 2003-2004:2003-2004 -p 2023-2024:2023-2024 -p 8125:8125/udp -p 8126:8126 graphiteapp/graphite-statsd:latest
  4. Open/Verify Graphite app:
    localhost:8080
  5. Install Grafana 6.4.3 version
  6. Pull docker image:
    docker pull grafana/grafana:6.4.3
  7. Run docker image:
    docker run -d --name=grafana -p 3000:3000 grafana/grafana:6.4.3
  8. Open/Verify Graphite app:
    localhost:3000
    Note: Default User/Password is admin/admin

Result Screenshot as below


How to add a Graphite as data source in Grafana.

How to add a Graphite as data source in Grafana.

Steps as below

  1. Go to :
    Configuration > Data Sources

  2. Follow step: shown in below image.

  3. Click Save & Test.

  4. For verifying the work
    - Create New Dashboard > Select Datasource > Make query/Select graphite metrics > select graph time span

Screenshot as below


How to setup Grafan on Local using Docker

How to setup Grafan on Local using Docker.

Steps as below

  1. Pull docker image:
    docker pull grafana/grafana:6.4.3
  2. Run docker image:
    docker run -d --name=grafana -p 3000:3000 grafana/grafana:6.4.3
  3. Open/Verify Graphite app:
    localhost:3000
    Note: Default User/Password is admin/admin

Screenshot as below


How to setup Graphite & Statsd on Local usig Docker

How to setup Graphite & Statsd on Local using Docker.

Steps as below

  1. Pull docker image:
    docker pull graphiteapp/graphite-statsd:latest
  2. Run docker image:
    docker run -d --name graphite --restart=always -p 8080:80 -p 2003-2004:2003-2004 -p 2023-2024:2023-2024 -p 8125:8125/udp -p 8126:8126 graphiteapp/graphite-statsd:latest
  3. Open/Verify Graphite app:
    localhost:8080

Screenshot as below

Graphite


Elasticsearch - Nodes, clusters, and shards

Elastic Stack Video - Load your gun in short time.   Beginner's Crash Course to Ela...

Recent Post